ASTC conference
So, one of the doctors, Amanda Scott, is actually not in (at least in a physical sense). I’m excited to be at the American Society of Trial Consultants annual conference in Asheville, North Carolina. As our business continues to grow, I’m learning more about the field and meeting lots of other practitioners.
Highlights of the conference program for me include:
The schedule is pretty packed so I may or may not get a chance to explore Asheville, but I’m thrilled at the opportunity to meet so many new folks, who so far have been very welcoming.
Climate Change – Stable Trends in Public Opinion Over Time
In an interview with USAToday’s Dan Vergano, Dr. Orie Kristel provides an overview of analyses The Strategy Team, Ltd. recently conducted for the Skoll Global Threats Fund regarding climate change polling data.
Opinion Polling and Elections – Today and Into 2012
It has been an exciting election year in Ohio! Issue 2 garnered national attention, as voters had the chance to repeal Senate Bill 5, which, among other provisions, eliminated collective bargaining rights for all public sector workers. Senate Bill 5 ignited a movement that organized protests at the Statehouse in the spring, collected almost a million petition signatures to get the issue on the ballot, and resulted in the largest voter turnout in an off-year in two decades ultimately overturning the bill by a 61-39 margin. What does this defeat mean for politicians in Ohio, specifically Governor John Kasich who championed the bill, and for potential Republican presidential candidates, and thus President Obama in 2012? A recent public opinion poll conducted among 2011 Ohio voters provides some clues.
The news is not good for Republicans. An opinion poll conducted by the Democratic firm Hart Research Associates offers insight into who voted against Issue 2, as well as how voters perceive Governor Kasich and potential GOP Presidential candidates. As expected, Democrats voted overwhelmingly against Issue 2 (94% voted no), but 57% of independents and 30% of Republicans voted no as well. Responses to additional questions reveal that Kasich’s approval rating among those who voted for him in 2010, but voted against Issue two, is a dismal 28%. In the GOP Presidential arena, 49% said they would be less likely to support Mitt Romney, and 51% said they would be less likely to support Rick Perry after hearing that both Romney and Perry strongly supported Issue 2, (these percentages rise to 73% and 78%, respectively, among only those who voted against Issue 2).
However, all is not lost for the GOP. A somewhat less publicized outcome of this election was the passage of Issue 3, an amendment to the Ohio constitution championed by conservatives. The amendment is intended to exempt Ohioans from any “individual mandates” to purchase healthcare, part of the Affordable Care Act (ACA) passed by the Democratic Congress and considered a significant achievement of President Obama’s administration. The language of the amendment has been criticized by progressives as being dangerously vague, and the vote is viewed by many as symbolic because the legality of the ACA will be decided by federal courts, very likely the Supreme Court. Nonetheless, Issue 3 passed by a whopping margin: 66 to 34.
As it stand in Ohio today, a majority of voters favored one cause championed by Democrats, and another championed by Republicans. Surely, public opinion polls in the coming months will attempt to uncover what issues are most important to voters and how these attitudes and emotions relate to their voting intentions. When conducted properly, opinion polls can predict voters’ actions quite accurately, as well as determine what messages are most persuasive, and thus are a valuable tool for political candidates and organizations. Today both parties appear to have opportunities, and it will be up to them to harness the key issues in ways that will successfully win over voters. And at least in Presidential elections… “as Ohio goes, so goes the nation.”
Polling, communications strategy, and Ohio Senate Bill 5
Governmental entities, nonprofit agencies, or their private-sector communication partners often want to learn 1) the psychological “hot buttons” that may generate a desired response (e.g., “Give time/money!” “Vote yes on Issue X!”) and 2) the psychological “red flags” that may generate an undesired response.
We find this type of research fascinating and oddly exciting. However, confidentiality agreements limit our ability to talk about most of the work we’ve conducted in this capacity.
Just last week, however, we became aware of survey results from the independent Quinnipiac University Polling Institute regarding a highly contentious issue in Ohio: Senate Bill 5. These results have the potential to guide communications strategy, and because we are a neutral party to the issue*, we are able to comment on it.
For those who may be unaware, Senate Bill 5 calls for major changes to Ohio’s labor laws. As may be expected, the passage and eventual signing of Senate Bill 5 led to a strong outcry from those who are most likely to be negatively affected by the legislation, including state and municipal employees and teachers. Over the past few months, hundreds of thousands of Ohioans have signed a petition with the intent to repeal this law, with a major political fight brewing for November 2011.
In Quinnipiac’s poll of registered voters, we noticed there were two questions asked of respondents that demonstrates how research has the potential to affect communications strategy.
Half of the 1,600+ respondents were randomly selected to hear the following question:
As you may know, there is a new law in Ohio that would limit collective bargaining for public employees. Do you support or oppose limiting collective bargaining for public employees?
The other half of the respondents were asked a slight variation of the same question:
As you may know, there is a new law in Ohio that would limit collective bargaining rights for public employees. Do you support or oppose limiting collective bargaining rights for public employees? (emphasis added)
How much difference can one word make? As shown in the chart below, including the word “rights” leads to changes in the percent of individuals who say they oppose this law – changes that approach statistical significance (meaning the difference is unlikely to have been caused by chance alone). This effect is strongest among registered Democrats, most of whom report a desire to oppose the legislation.

Although this pattern is small, it shows how quality research has the potential to influence communications strategy. In other words, if these polling patterns remain stable or become stronger through the rest of the summer, I would expect those groups that oppose Senate Bill 5 (and who favor its repeal) to position the repeal issue in terms of worker rights that are threatened. Time will tell.
* The Strategy Team, Ltd. has not been retained by individuals or groups on either side of this issue. Like the majority of Ohioans, we’re interested observers.
The Race for Governor: Closer than previously reported?
A recent Cincinnati Enquirer/Ohio Newspaper Poll reveals Republican John Kasich is ahead of Democrat Ted Strickland by 4 percentage points in the race for Ohio’s governor. Why the dramatic difference between this poll and the Columbus Dispatch poll published September 5th, which found Kasich ahead by 12 points? No extraordinary news event has occurred since then to potentially harm Republicans or help Democrats.
As discussed in our previous post, nonresponse bias, a particular problem in mail surveys, likely played a role in inflating Kasich’s lead in the Dispatch poll. The new poll was conducted over the phone – utilizing both landline and cell phone numbers – with a representative sample of 852 likely voters. I’d be more confident in the numbers produced by the latter methodology than a mail survey.
Plenty of time remains between now and November 2nd for Kasich to widen his lead or Strickland to build a comeback. But for now, it seems both candidates still have a chance to win the race.
Political Polls and the Implications of Nonresponse Bias
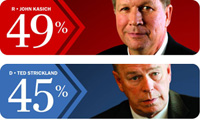
Election season is upon us and the polls abound. The Columbus Dispatch recently conducted a poll of registered Ohio voters that found Democratic incumbent governor Ted Strickland trailing Republican John Kasich by a whopping 12 points (49% Kasich, 37% Strickland, 10% undecided). In an election season infused with anti-incumbent fervor, Kasich’s lead may not be surprising. On the other hand, this particular 12-point gap seemed a bit odd, and led us to further examine how the poll was conducted.
The Dispatch conducted a mail survey, and calculated poll numbers from the 1,622 registered Ohio voters who completed and returned their ballots. The response rate was 14%, not unusually low for mail surveys. Nevertheless, one might wonder about possible nonresponse bias: did the opinions of the 86% of registered voters who received the ballot but did not return it differ from those who did return ballots? And if so, how might this affect the overall results?
As an example, in the 2006 midterm elections, 49% of actual voters were male and 79% were white. In the Dispatch poll, these groups were overrepresented: 52% of respondents were male and 87% were white. Do these discrepancies matter when drawing conclusions about likely election results? Only if the opinions of male voters differ from female voters, or, if the opinions of white voters differ from the views of non-white voters.
As it turns out, male and white voters are generally more likely to vote Republican than their female and non-white counterparts, as the Dispatch poll itself reveals (see below):
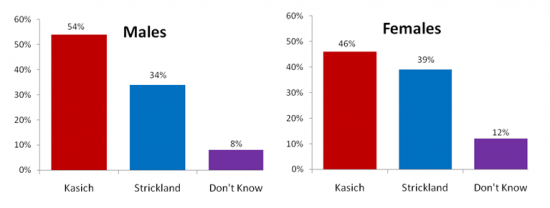
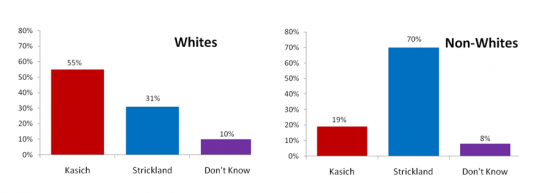
So, would the conclusions drawn from this poll change if more female and non-white voters had returned their ballots? It is likely John Kasich would still be ahead of Strickland, but his lead might not seem so formidable.
How neighbors stay informed about community issues
I recently happened upon a public opinion poll from the Pew Research Center that explored a topic that I’ve been curious about for some time. In this age of Facebook, Twitter, blogs, text messaging, and e-mail, how are Americans staying informed about what’s going on in the world closest to them – their neighborhoods, their communities? To what extent has “tech” entered this arena, and to what extent are Americans staying abreast of events the old-fashioned way, by talking face-to-face?
According to those surveyed, at some point in 2009…
- 46% of Americans talked face-to-face with neighbors about community issues.
- 22% of Americans signed up to receive alerts about local issues (such as traffic, school events, weather warnings or crime alerts) via email or text messaging
- 21% of Americans discussed community issues over the telephone.
- 20% of Americans used digital tools to talk to their neighbors and keep informed about community issues.
- 11% of Americans read a blog dealing with community issues.
- 9% of Americans exchanged emails with neighbors about community issues and 5% say they belong to a community email listserv.
- 4% of Americans communicated with neighbors by text messaging on cell phones.
- 4% of Americans joined a social network site group (e.g., Facebook) connected to community issues.
- 2% of Americans followed neighbors using Twitter.
[Note: Emphasis added. Because survey participants could respond affirmatively to more than one option, the sum of percentages is > 100%.]
One of the take-away messages from this report is that while high-tech communication modes have a place in how Americans stay connected to one another and to their community, use of these modes does not (yet) surpass good ol’ fashioned discussions over the backyard fence or across porches. If one’s marketing objective is to mobilize grassroots support, to build local awareness of an issue, or to mobilize a community to action, these data seem to suggest the best kind of “word-of-mouth” tactic may be the original kind – by encouraging people to literally talk with one another.

[Survey methods note: The survey was conducted via telephone (either landline or cellphone) with a random sample of 2,258 American adults. The full report can be downloaded here.]
Research in action – projecting demand for a second campus
One of my favorite parts of applied research is… well… its application. Back in 2003, TST helped Columbus State Community College project demand for a second college campus and determine where said campus might be located. We used GIS mapping, surveys and focus groups with students and stakeholders as well as a RDD survey of the four county area surrounding Columbus to provide CSCC with the information they needed to make a good decision. TST documented and projected enrollment trends, created demographic and lifestyle profiles of current and potential future students and highlighted potential barriers and supporting factors that could impact demand for (and construction of) a second campus.

Artist rendering of second Columbus State Community College campus
On June 28th, the ribbon cutting for the second campus (located very near one of the locations we suggested 7 years ago!) will take place. I’d like to think we helped provide the foundation for that building – pun intended.